Our dashboard enables decision makers and the public to stay informed during the flu season and examine forecast performance in retrospect, with up-to-date forecasts up to three weeks out. Anticipating flu activity helps manage uncertainty and risk from both the public health and individual perspectives. CDC's FluSight forecast hub coordinates the efforts of research teams across the country in predicting rates and trends of flu hospitalization on the national and state level, with consistent forecasting since the 2021-2022 season.
Explorable visualizations are a powerful tool for distilling and understanding this wealth of information. We present several models affiliated with Epistorm as well as FluSight's ensemble of the dozens of models participating in the forecast hub. Our Forecasts page displays observed ongoing and anticipated flu activity with characterizations of its relative severity and directional trends. Our Evaluations page provides easy comparison of model performance in both immediate retrospect and season-by-season, as well as a detailed view of individual models' weekly performance over time.
Equips US public health officials, policymakers, health care providers, and the public with easily digestible and explorable visualizations of up-to-date flu activity forecasts and evaluations of forecast performance.
Influenza forecasting uses statistical and computational models to predict key aspects of seasonal flu activity, including weekly hospital admissions data, changes in epidemic trends, and peak activity. The influenza season typically runs from October through May in the United States, with peak activity usually occurring between December and February, though timing and severity can vary significantly from year to year. FluSight is the CDC's collaborative influenza forecasting initiative that brings together academic institutions, private companies, and public health agencies to generate real-time predictions about flu activity across the nation[1]. Through FluSight, participating teams submit weekly forecasts using diverse modeling approaches, which are then synthesized into ensemble predictions that help public health officials make informed decisions about resource allocation, vaccination campaigns, and public health messaging during the flu season.
The Epistorm consortium employs multiple models using different methodologies to provide influenza forecasts to the FluSight forecasting challenge. This platform presents weekly forecasts of hospital admissions, predicted epidemic trend changes, and seasonal activity levels, along with a robust evaluation page to assess forecast performance.
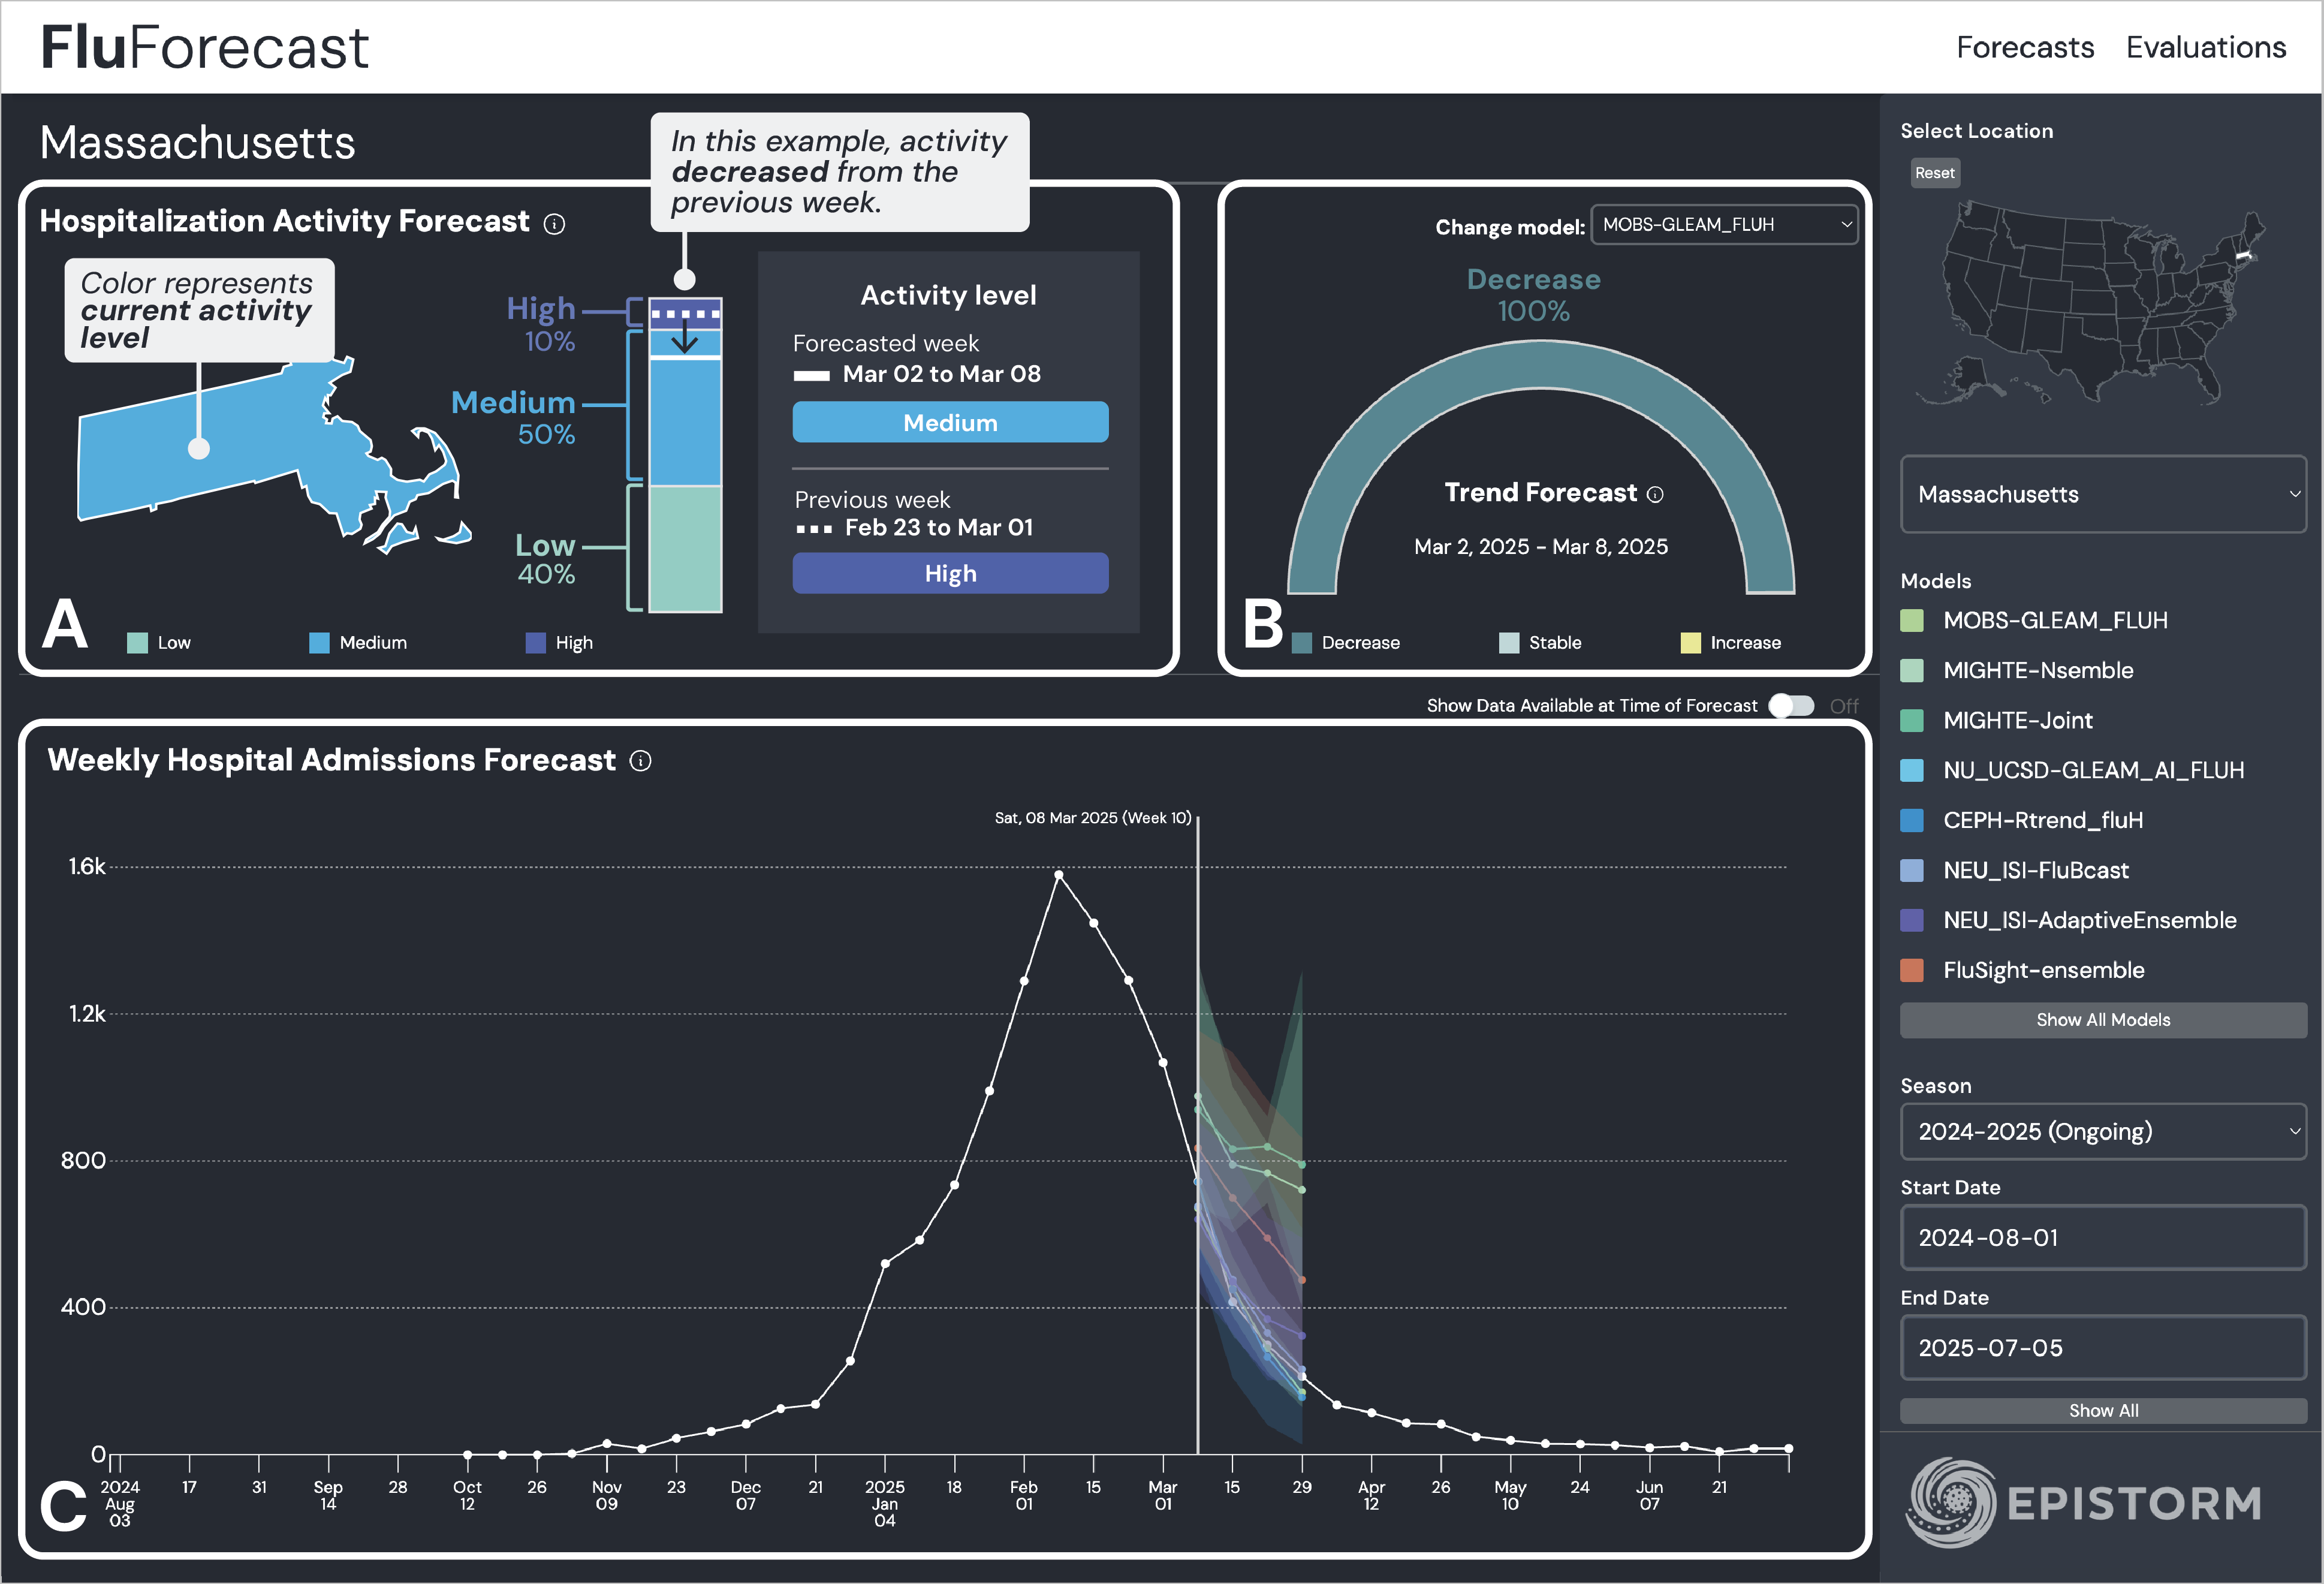
Forecasting page of the FluForecast dashboard
The forecast page displays three types of information:
A. Hospital Activity Forecast shows current and previous week activity levels relative to previous seasons, categorized as High, Medium, and Low based on NSSP hospital admission data.
B. Trend Forecasts are generated by a subset of Epistorm models to estimate how influenza activity is expected to change compared to the previous week, displayed as an arc of bars where bar size represents the probability of activity increasing, decreasing, or remaining stable, with additional details available on GitHub.
C. Weekly Hospital Admission Forecasts provide four-week-ahead predictions from multiple models for weekly new hospital admissions at both national and state levels, showing central estimates alongside prediction intervals to represent model uncertainty and allowing users to view both current conditions and anticipated trends.
The evaluations page shows model performance aggregated across time and geographic location using standard scoring metrics including the weighted interval score, mean absolute percentage error, and coverage.
The page features interactive box plots comparing model performance across different metrics, with options to filter by forecast horizon and time periods spanning multiple flu seasons.
A state-specific map visualization shows geographic variation in model performance. Users can toggle between different scoring metrics and select specific models from the eight participating forecasting teams to conduct detailed comparative analyses across location and time. There are also additional analyses of single model performance per location over time.
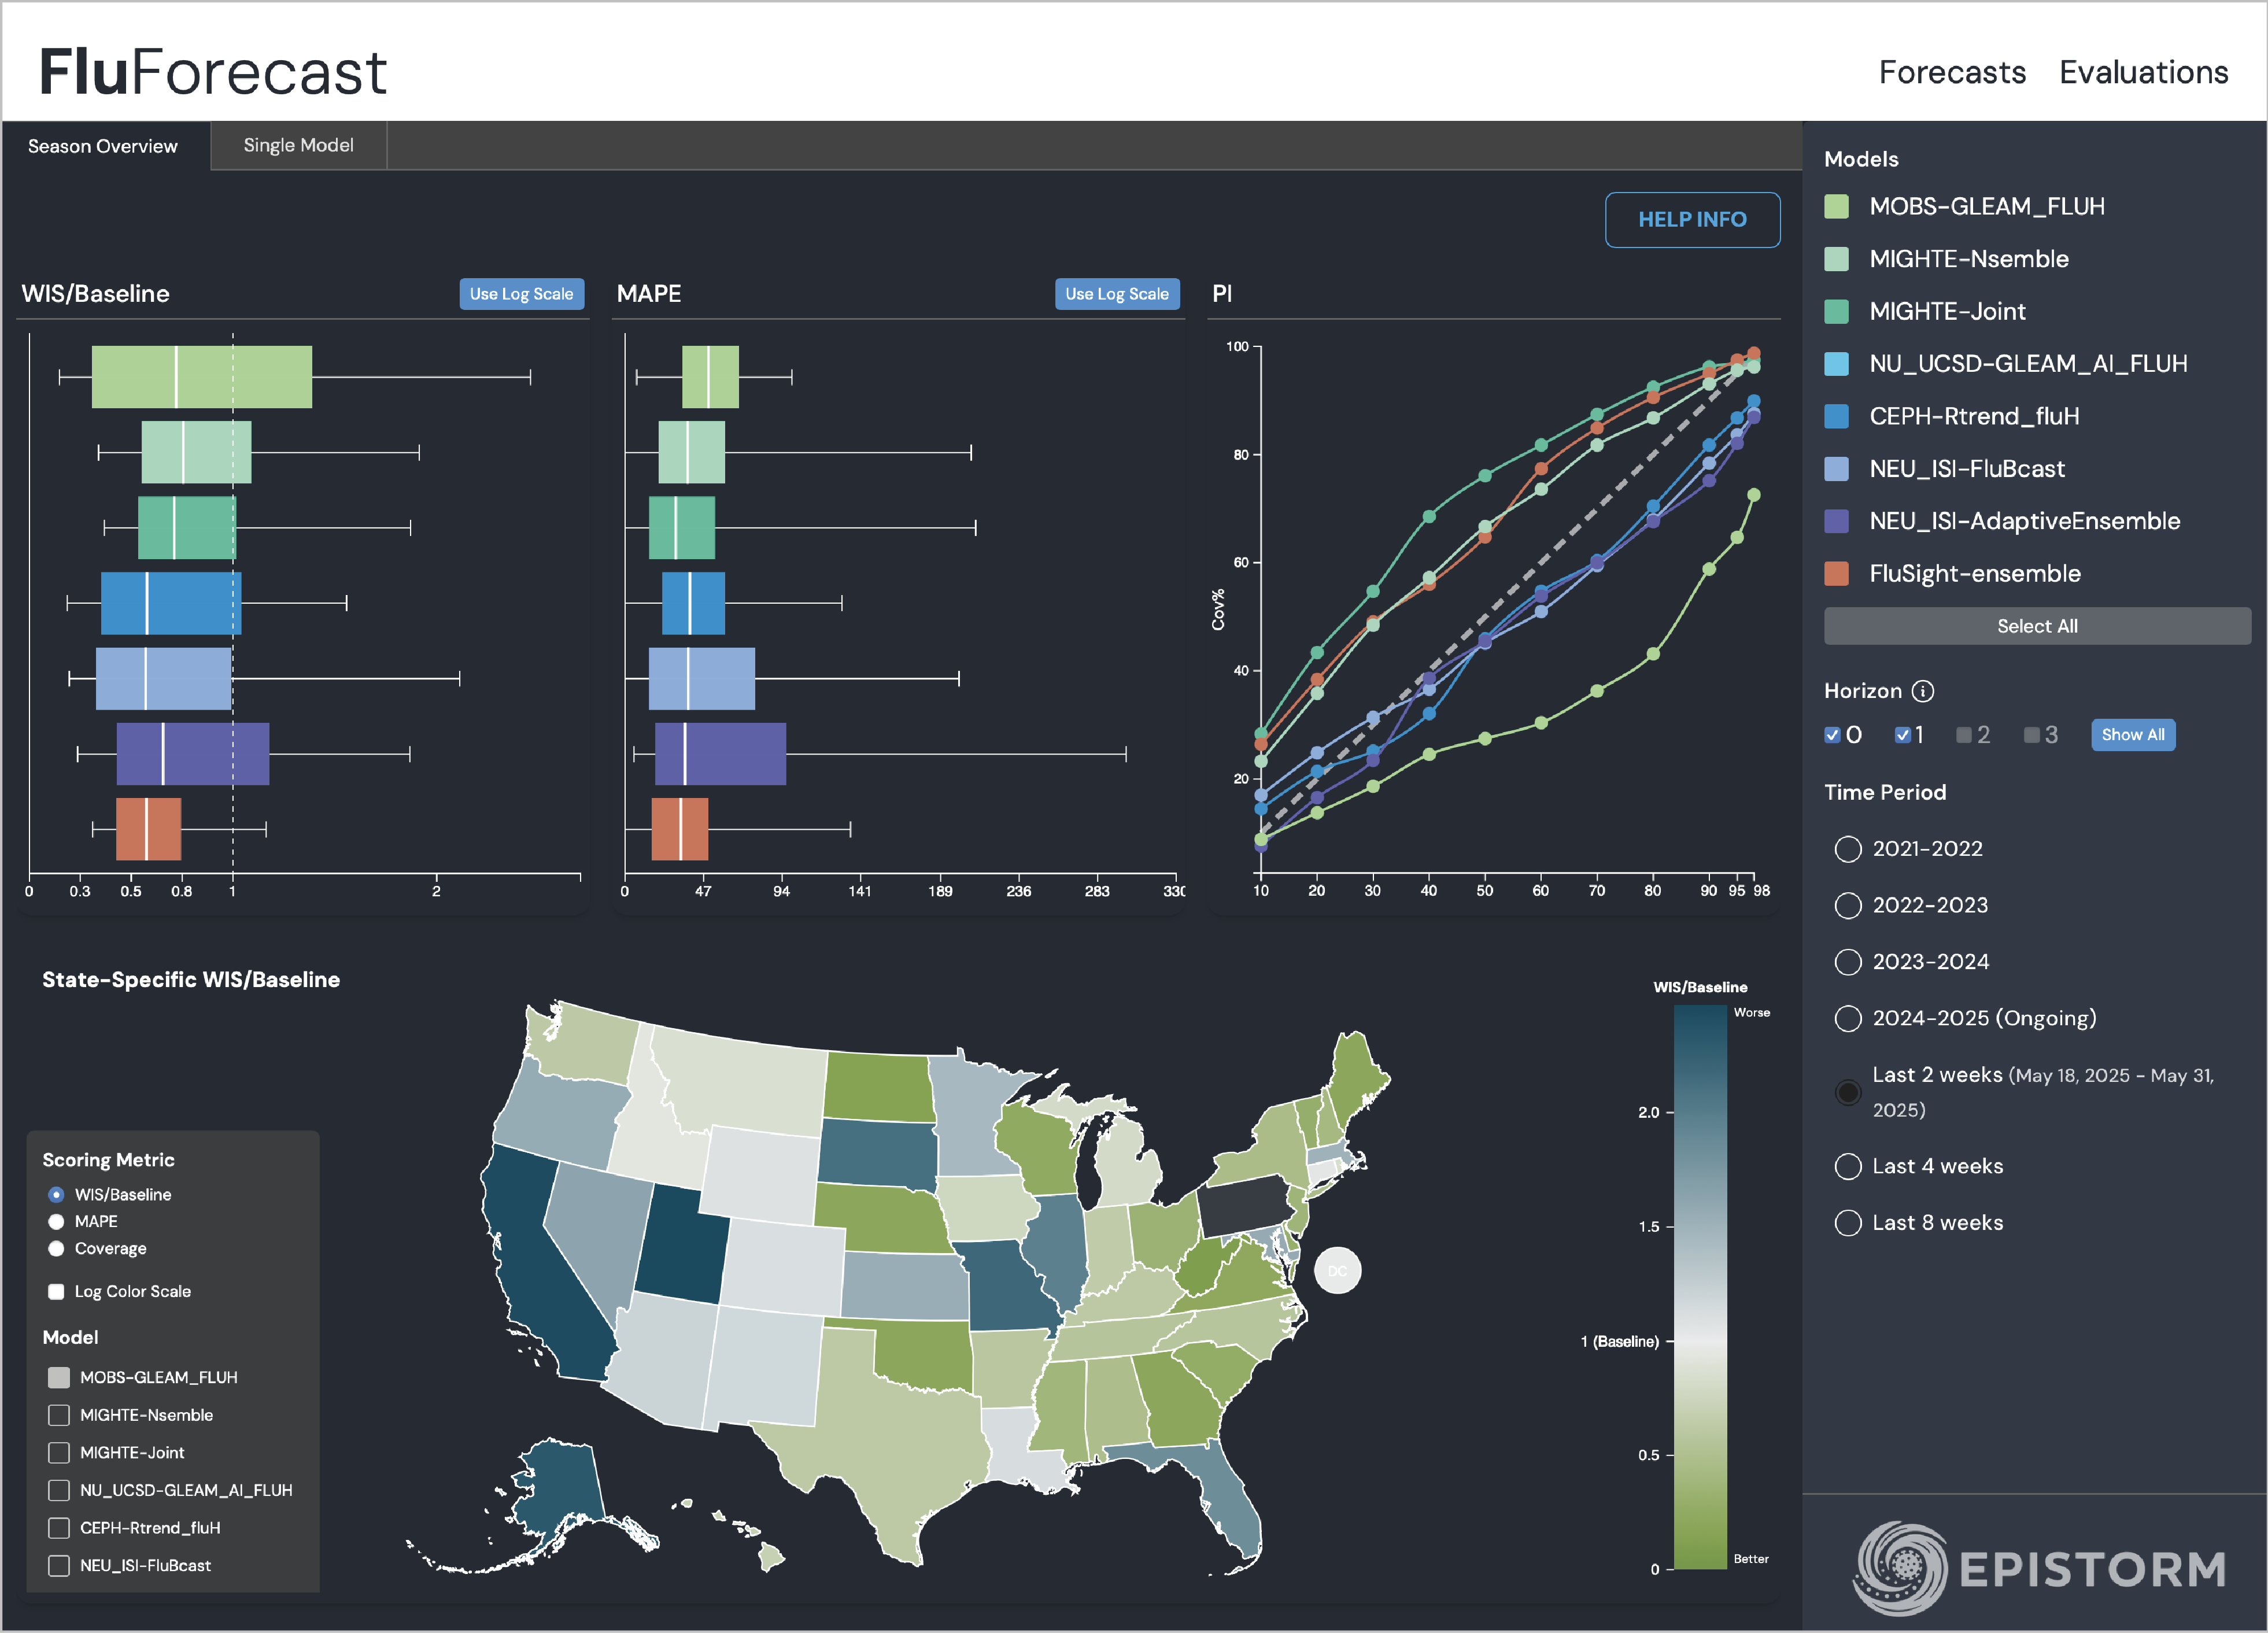
Evaluations page of the FluForecast dashboard
The GLEAM framework is based on a metapopulation approach in which the US is divided into geographical subpopulations. Human mobility between subpopulations is represented on a network. This mobility data layer identifies the numbers of individuals traveling from one sub-population to another. The mobility network is made up of different kinds of mobility processes from short-range commuting between nearby subpopulations to flights. To model short-range mobility such as commuting or car travel, we rely on databases collected from the Offices of Statistics of 30 countries on five continents. Superimposed on the US population and mobility layers is a compartmental epidemic model that defines the infection and population dynamics.
Weighted ensemble of time-series models, including lightGBM with hyperparameters tuned over the previous season, lightGBM validated over the previous season and tuned on the season before, and ARIMA models.
Weighted ensemble of time-series models, including lightGBM, ARIMA models, and autoregressive models (ARGO2).
This is a deep surrogate model trained to mimic the MOBS-GLEAM_FLUH model. GLEAM_FLUH is based on a metapopulation approach in which the world is divided into geographical subpopulations.
Human mobility between subpopulations is represented on a network. This mobility data layer identifies the numbers of individuals traveling from one sub-population to another.
The mobility network is made up of different kinds of mobility processes, from short-range commuting between nearby subpopulations to intercontinental flights.
To model short-range mobility such as commuting or car travel, we rely on databases collected from the Offices of Statistics of 30 countries on five continents. Superimposed on the worldwide population and mobility layers is an agent-based epidemic model that defines the infection and population dynamics.
Model forecasts are obtained by using a renewal equation based on the estimated net reproduction number Rt.
We apply a lowpass filter to the time series of daily hospitalizations, extracting the main trend. We then use MCMC Metropolis-Hastings sampling to estimate the posterior distribution of Rt based on the filtered data, considering an informed prior on Rt based on influenza literature.
The estimated Rt in the last weeks of available data is used to forecast Rt in the upcoming weeks, with a drift term proportional to the current incidence. Finally, we use the renewal equation with the posterior distribution and trend of the estimated Rt in the most recent weeks of influenza data.
FluBcast is a compartmental behavioral feedback model that simulates the feedback loop by explicitly representing different behavioral classes within the population. Specifically, it is a stochastic, age-structured compartmental model that integrates behavioral changes through a new compartment of risk-averse susceptible individuals.
The adaptive ensemble approach combines projections from the Flu Scenario Modeling Hub across all defined scenarios. The approach leverages new surveillance data points to generate an adaptive ensemble by dynamically rejecting the subset of individual models' trajectories that do not closely match the observed trends.
The Hubverse package hubEnsembles is used to generate the FluSight-ensemble forecast. A median of quantile outputs is used for all eligible quantile-based forecasts. The mean is used to ensemble probabilities from eligible categorical rate-trend forecasts.

.png)